↗ EXPAND
FROM MORPHOLOGY TO MOLECULES
Every cell has
a story.
Read it from H&E.
Morph2Mol predicts single-cell transcriptomes from routine histology, reading each cell’s morphology and spatial context across 18,580 genes.
University of Michigan · Weill Cornell Medicine
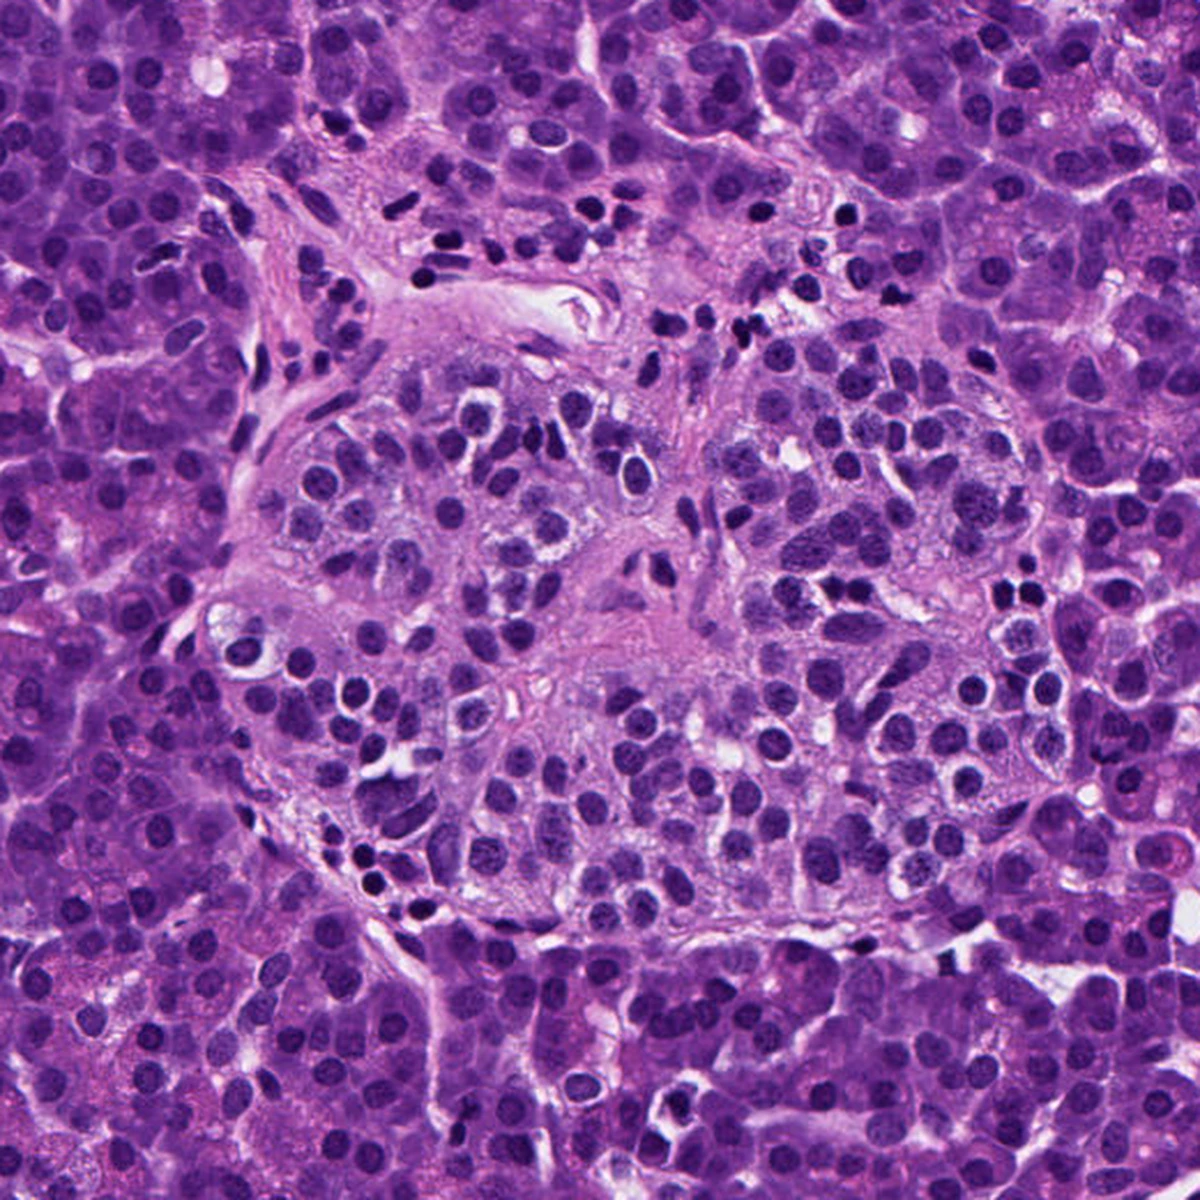
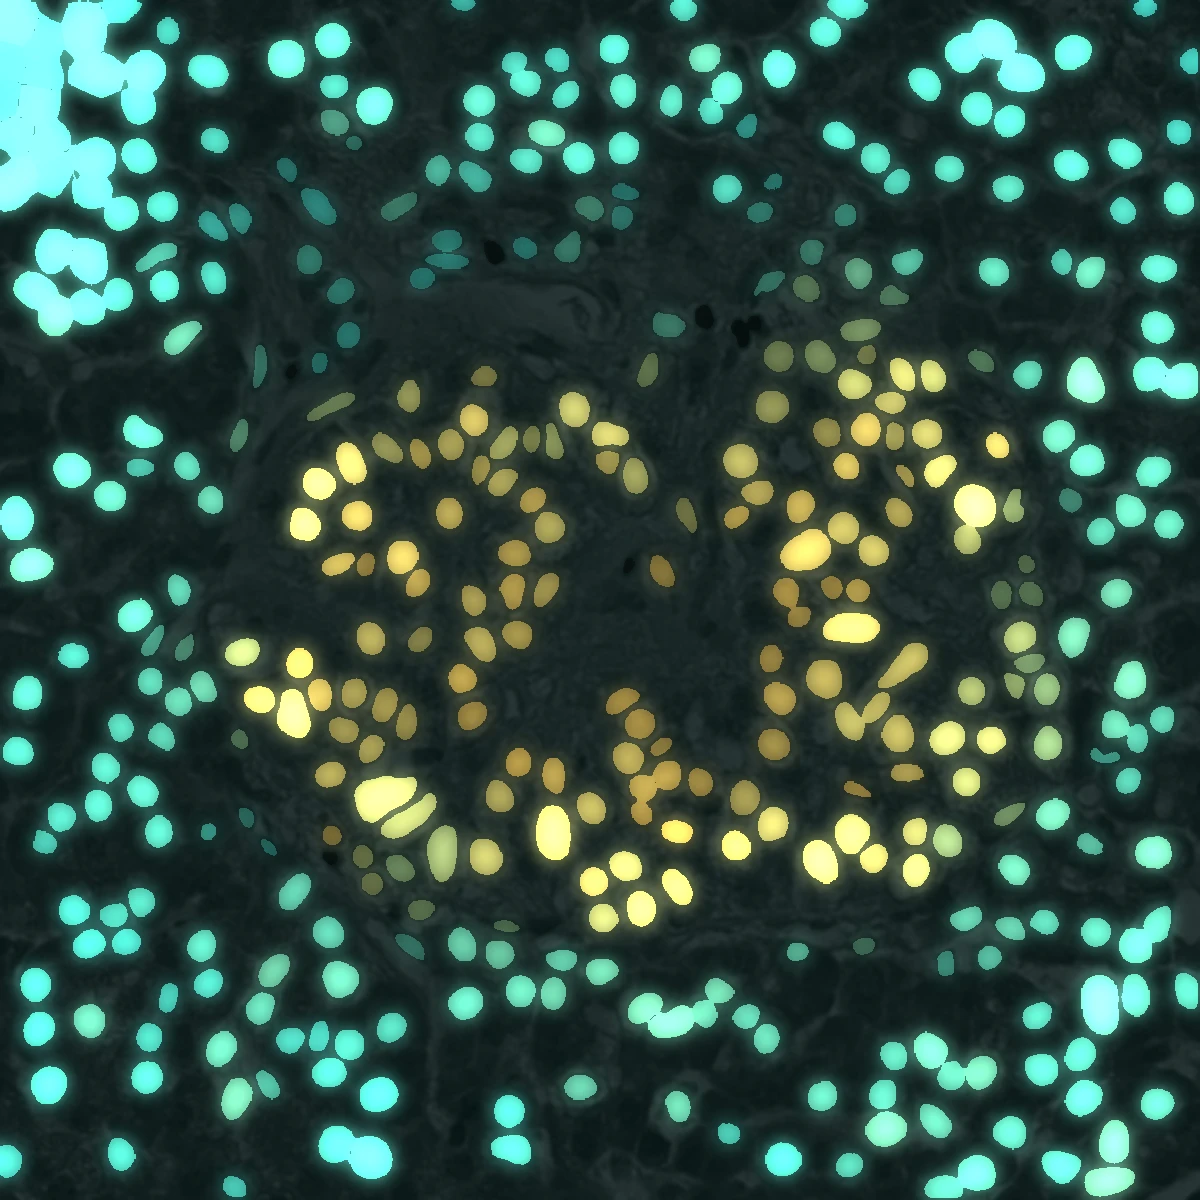 H&EMorph2Mol
25.4M
cells used for training
18,580
output genes
15
training tissue types
3.58M
held-out evaluation cells
01 / SELECTED APPLICATIONS
See single-cell transcriptomes
in spatial context.
From the architecture of an islet to the molecular programs of disease. Selected results from the Morph2Mol manuscript.
02 / THE MODEL
One image.
Multiple layers of insight.
Morph2Mol combines morphology, spatial context and measured reference profiles. Its predictions are molecular scores—not measured molecule counts.
STAGE 01
→Align
Cell-resolved histology representations align with scGPT transcriptomic features through contrastive learning.
STAGE 02
→Contextualize
A spatial-attention decoder models cells and their neighbors to predict expression and generate cell embeddings.
STAGE 03
Retrieve & fuse
Gene-specific weights combine direct predictions with expression retrieved from reference-cell clusters.
03 / MORPH2MOL WORKBENCH
Your tissue.
A new perspective.
Upload a small H&E region, enter its physical resolution, and predict cell-level expression with cloud GPU inference.
NO IMAGE? START HERE
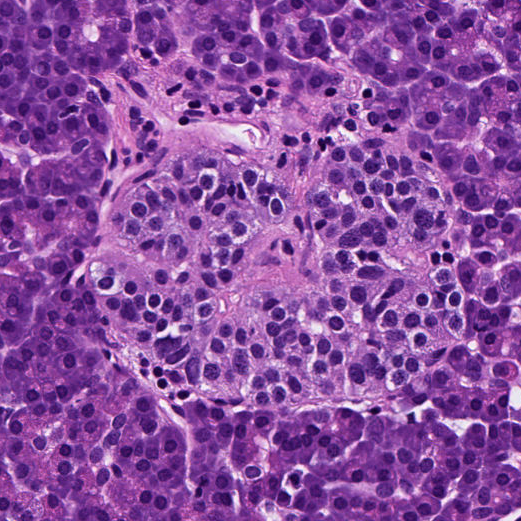
Pancreas demo
A 521 × 521 px islet region from an HPAP donor with type 1 diabetes. Look for higher LTB in B cells next to CCL19-high endothelial cells at the islet edge. Upload it with the settings below, or click Pancreas demo inside the workbench to fill everything in.
- 0.46 µm/pixel
- Tissue: Pancreas
- LTB · CCL19 · CCL21 · MX1 · CHGA · GCG
Checking inference service…PNG / JPEG / TIFF · up to 1024 × 1024 px · 20 MB
Free GPU time is limited per visitor. If the workbench reports that your ZeroGPU quota is used up, sign in to Hugging Face and open the workbench there ↗ to use your account’s quota.
01
Cell boundaries
Predicted nuclei and source-image coordinates.
02
Expression maps
View each gene relative to the other cells in your image. All tissues use within-image z-scores; download fused scores and z-scores as AnnData.
03
Cell embeddings
Stage 2 image features and spatial features as NPZ.
Research use only. Use de-identified images. Processing runs on Hugging Face; free GPU access is subject to availability and daily quotas. Whole-slide analysis is available through the command-line pipeline.
OPEN SCIENCE / MORPH2MOL
Morph2Mol: A Foundation Model for
Predicting Single-Cell Spatial Transcriptome
from Histology Images
Xin Luo*, Haoxuan Zeng* and colleagues